Example of widefield particle extinction analysis using
Extinction Suite v4.0.2
Unzip Data.zip
Data.zip contains 1 folder: "Data", which should
be treated as the base folder for this analysis.
"Data" contains 1 folder: "ProcessedImage".
"ProcessedImages" contains 4 developed extinction
images: "Extinction_600.tif", "Extinction_550.tif",
"Extinction_500.tif", "Extinction_450.tif".
The data in this example analysis was taken in the synchronously
triggered stage-camera format using single recording over all color
channels and using the shifted reference method, so that there is a
single saved signal file, and a single saved background (dark
sensor) file. The recording settings are 128 images per signal
position and 128 per reference position with 10 repetitions,
yielding \(128\times2\times10=2560\) total brightfield images per
color channel. The background image assumes a single
exposure time in brightfield for all color channels, and therefore
contains only 2560 images (i.e. NOT 4\(\times\)2560 images) of the
dark sensor for this single exposure time.
1. Run ExtinctionSuite v4.0.2
- Plugins \(\rightarrow\) ExtinctionSuite v4p0p2
- Make sure no other images are open in ImageJ/Fiji, and then
close the welcome prompt.
2. Mode Selection
- Choose Unpolarized.
- Choose Run Extinction Suite.
3. Module Selection
- Check "Perform Particle Analysis" only.
4. Choose Base Folder
- Navigate to the location of the unzipped Data folder
- Select .../Data
5. Analysis Options
- Click OK to use the analysis options in below screenshot.
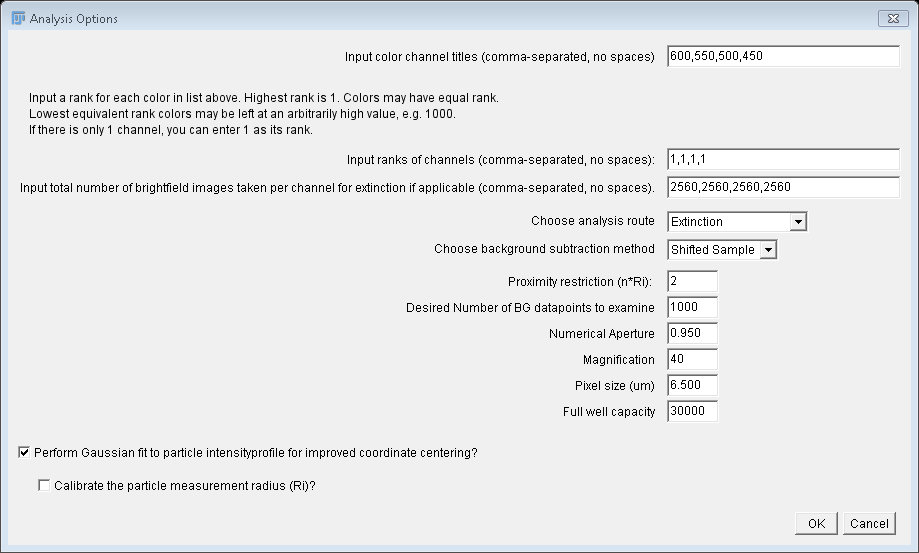
-
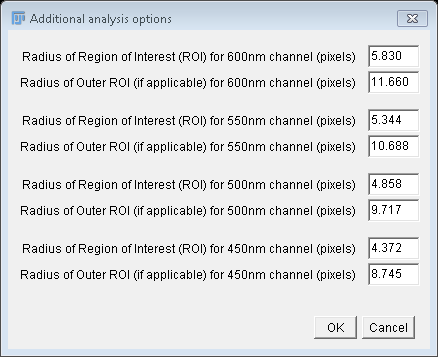
Additional analysis options (1) : Radius of ROI
- Click OK to use the provided values of \(R_\mathrm{i}\),
calculated for \(R_\mathrm{i}=3\lambda/2 NA\), with
\(\lambda\) varying over the different color channels.In
general these values are alterable by the user at their
discretion.
- Note only the inner radius ("Radius of ROI") is applicable
in this example since we use "Shifted Method" in above main
analysis options.
-
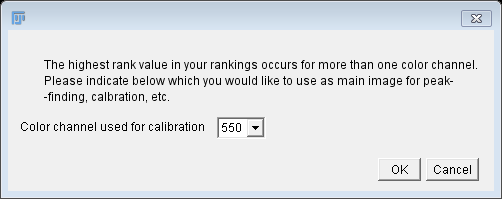
Additional analysis options (2): Selecting the Main Image
for Calibration
- For typical situations where there is only one color channel
chosen by the user to have the highest rank, or when there is
only one color channel, the "main" image used for peak finding
and calibration is simply the highest ranked image. However,
please note that in this case we have provided a ranking above
(1,1,1,1) which indicates that all images have the same rank.
In this situation (or in a situation where there are multiple
images equally ranked with the highest value rank), you will
be asked to choose the image which will be considered the
"main" image. In this example, we have chosen to use the 550nm
color channel.
- Select 550 from the dropdown menu and click OK.
-
User waiting period
- The software will now operate typically for <10s
(system-dependent) in order to determine the magnitude of the
reference shift in the \(x\) and \(y\) directions. Please do
not disturb ImageJ. You will be prompted upon completion (see
next part).
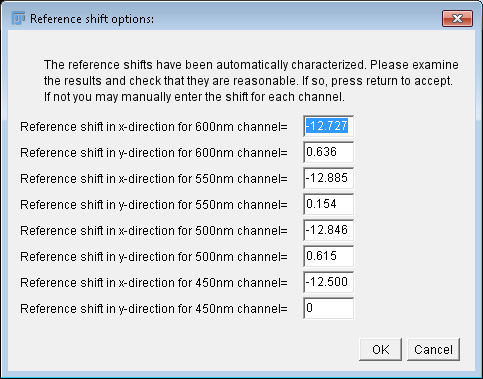
6. Reference shift confirmation
- Examine the window. The values displayed are the reference
shifts in units of pixels detected in each channel for
\(x\) and \(y\) directions.
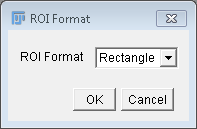
7. ROI Format
- Click OK to use Rectangular ROI Format.
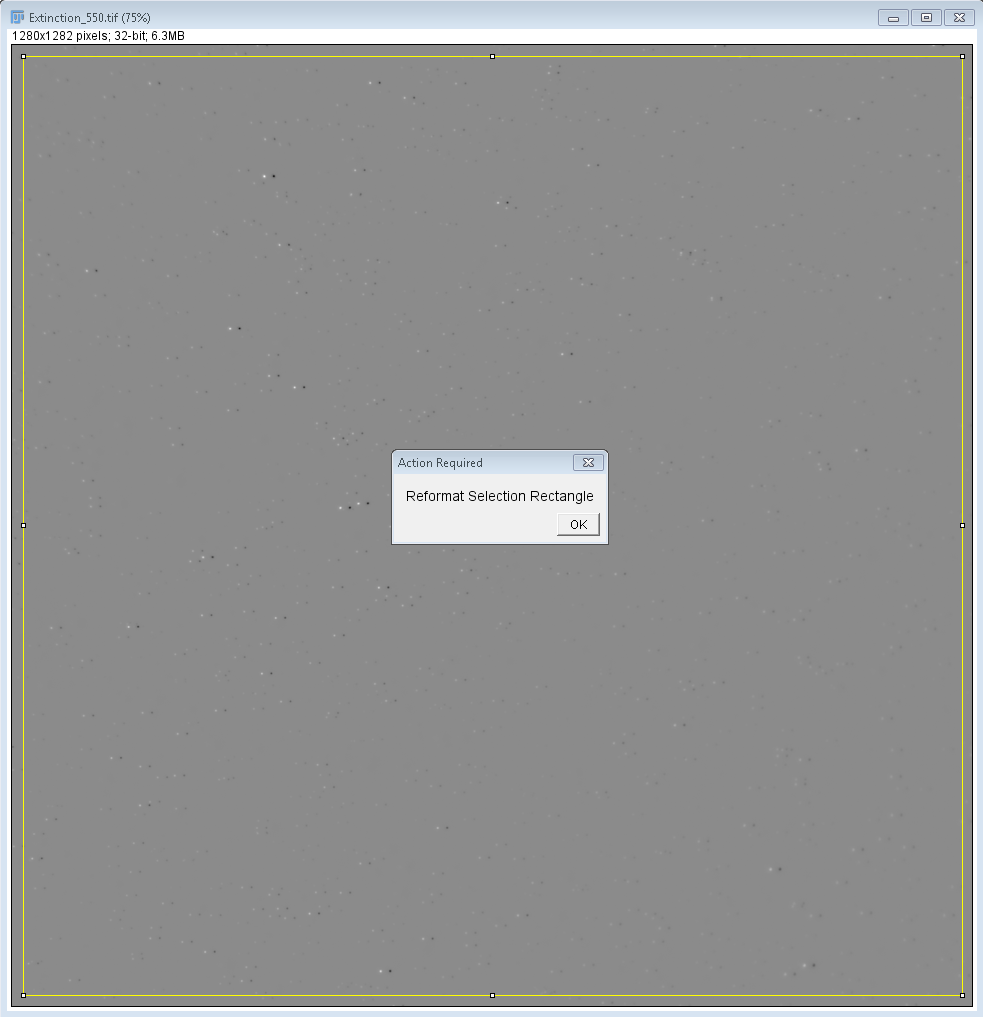
- Drag the corners of the ROI (yellow outline) to adjust the
rectangular selection to approximately obtain that seen in
screenshot below, then click OK.
8. Extinction Noise Tolerance
- Read the "Extinction Noise Tolerance" dialogue (seen
immediately below) carefully if it is your first time using
Extinction Suite.
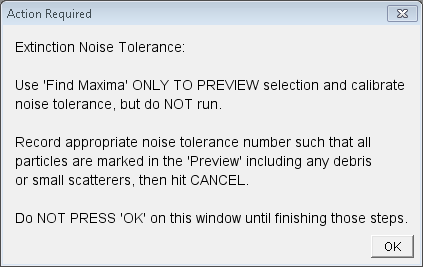
- Do NOT click OK, until you have performed the
specified actions in above panel.
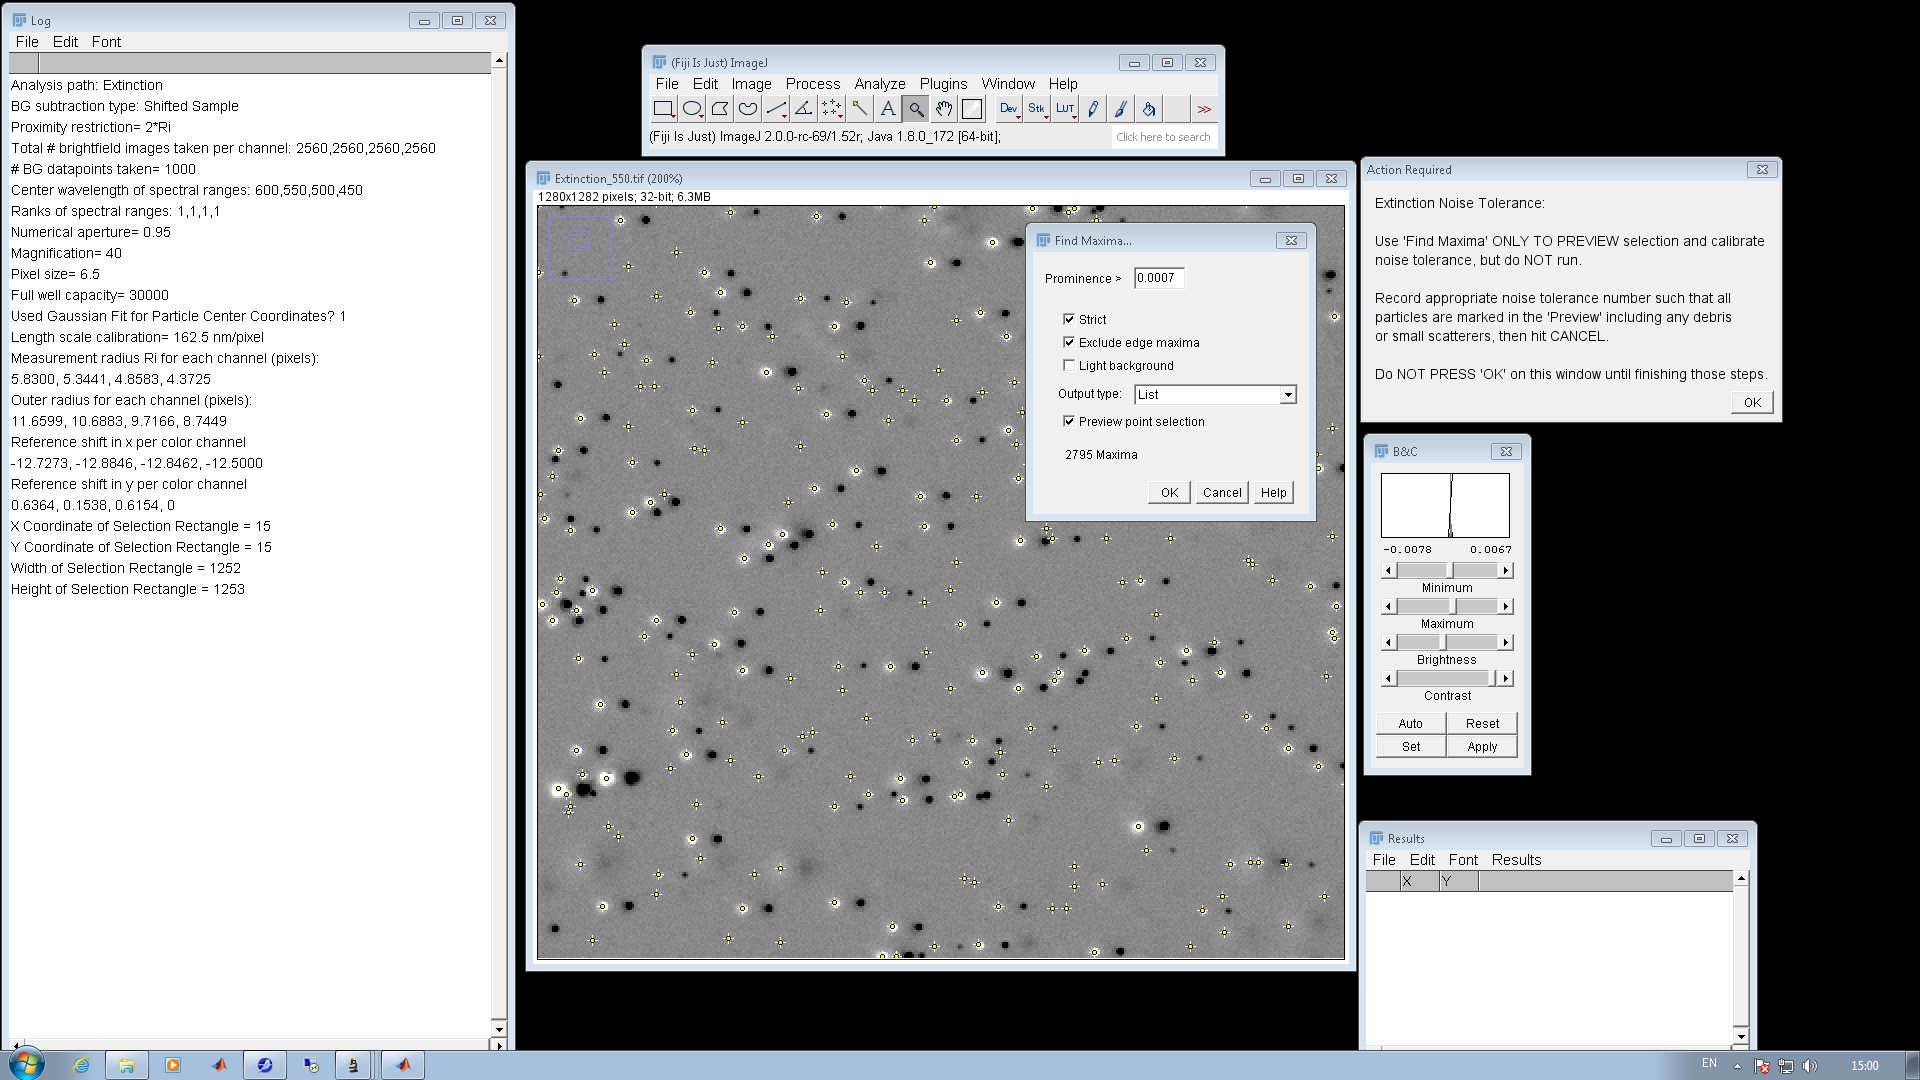
- From ImageJ GUI, run Process \(\rightarrow\) Find
Maxima... (an example workspace at this point is shown
immediately below).
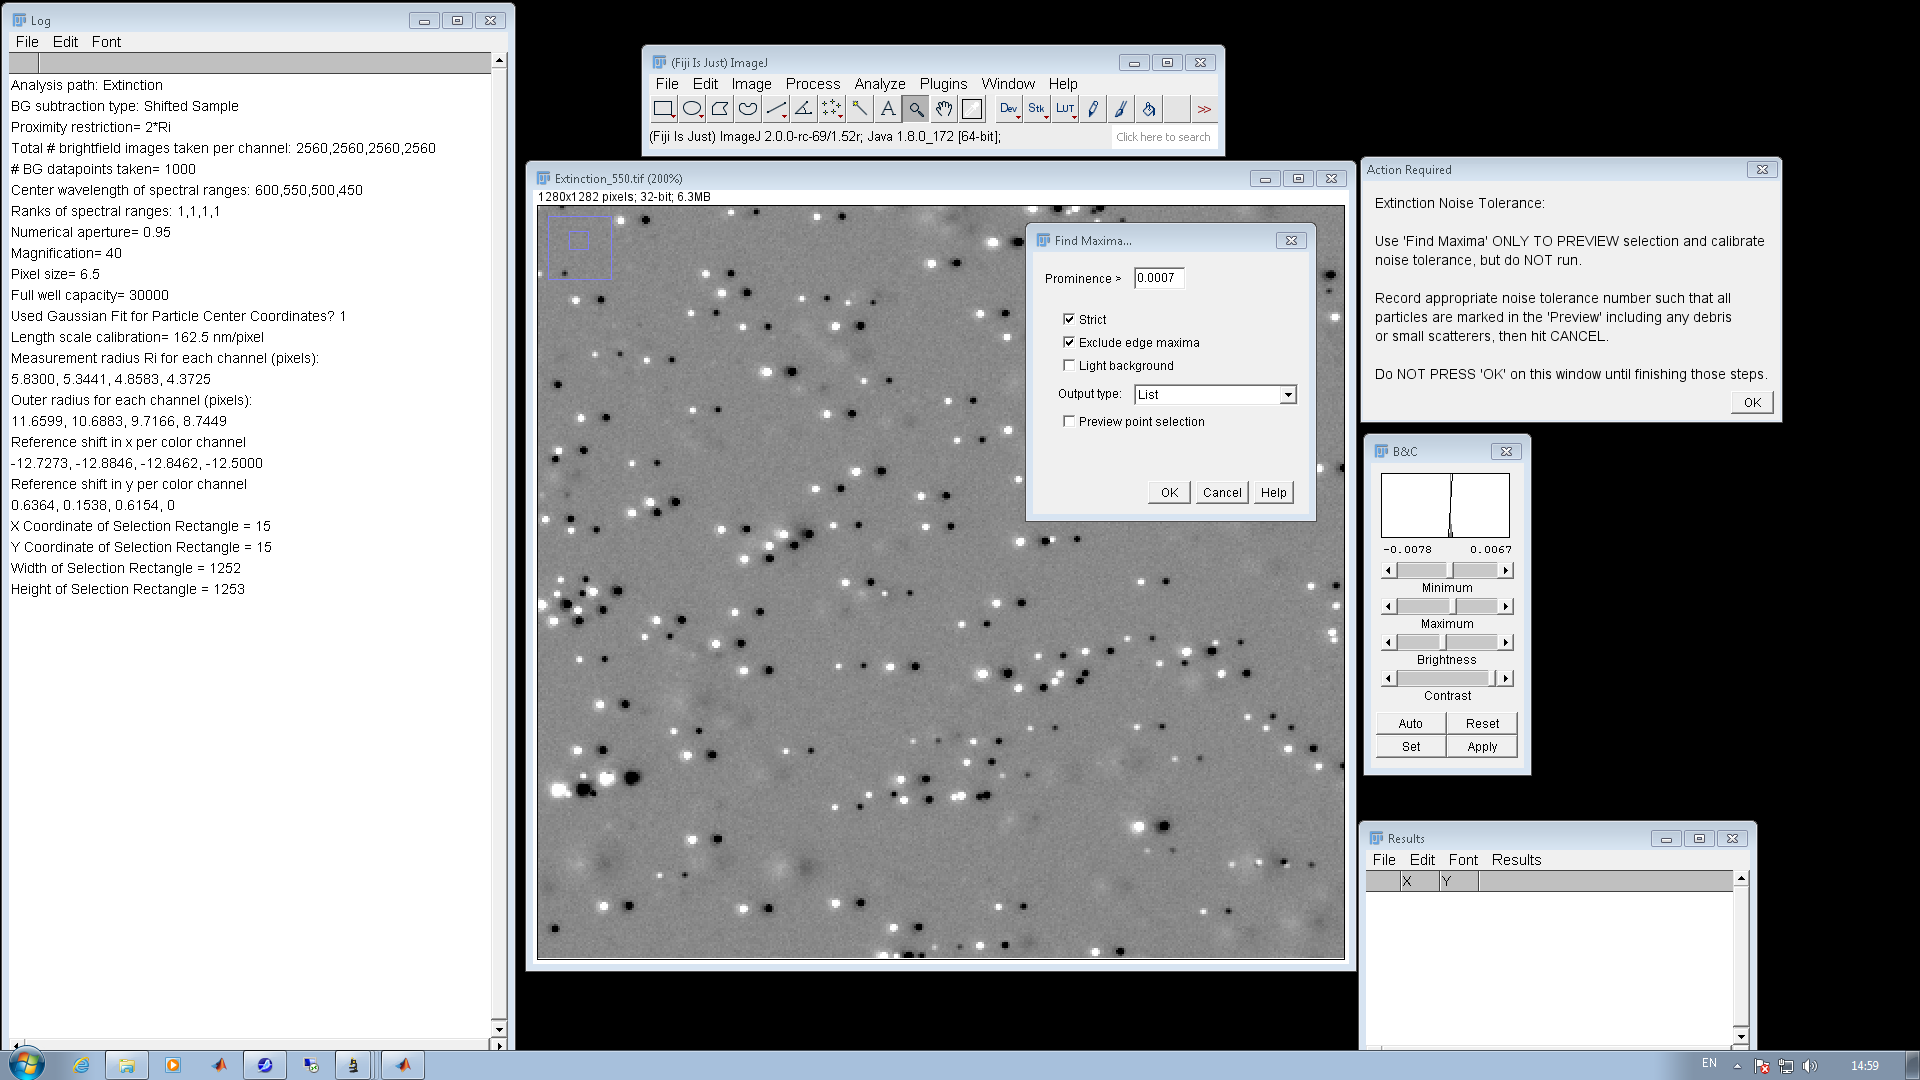
- In the Find Maxima Panel:
- Enter Prominence>0.0007.
- Check Strict
- Check Exclude edge maxima
- Do not check Light background
- Output type is irrelevant here.
- Check/uncheck "Preview point selection" to obtain a live
preview of the points which will be identified as maxima
using the value input above (0.0007). A screenshot with this
option checked using Prominence> 0.0007 is seen below:
- At this point, click Cancel on the Find Maxima panel, then
click OK on the Extinction Noise Tolerance panel.
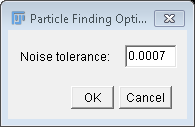
- You will be prompted to enter the chosen value for the Noise
tolerance.
- In this case, enter 0.0007 and click OK
9. Image Registration
- You will be prompted with a dialogue called "Registration
Check" (seen below). The values have been detected by an image
registration sub-routine examining the 4 different color
channels.
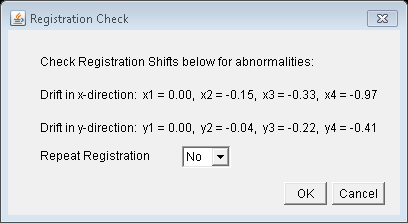
- The registration can be repeated if values are aberrant. In
this case they are good. Select No in the "Repeat Registration"
drop-down menu (if not already selected) and then Click OK
to continue.
-
User waiting period
- The software will now:
- Perform find maxima routine
- Check that selected peaks meet Proximity restrictions
(separation must be greater than 2\(R_\mathrm{i}\))
- Examine the background of the image (locations where no
peaks were detected and which meet proximity restrictions).
- Keep an eye on the "Log" window which updates with the
current operation of the code during this time.
10. Calibration of the cross-section acceptance range
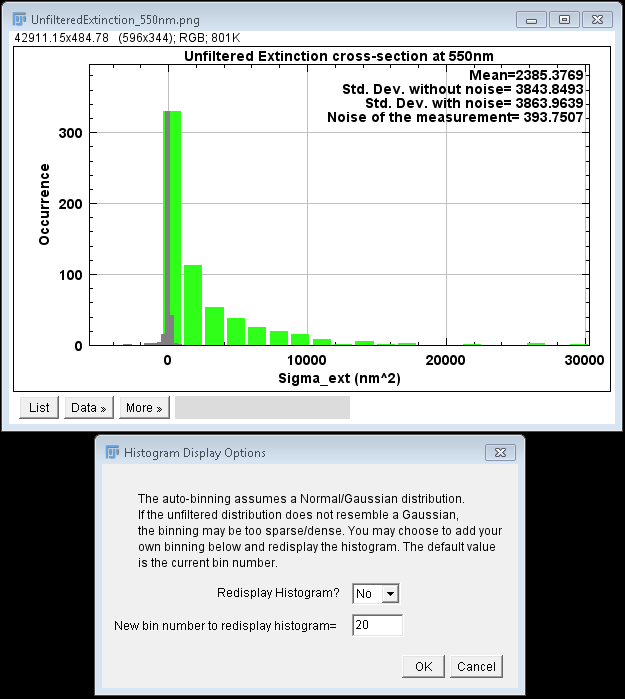
- When the above operations have completed, you will be
presented with the histogram of the cross-sections of all maxima
found using the example Prominence>0.0007 and which meet the
proximity restriction, for the color channel chosen as "main"
image earlier on.
- This histogram is presented with a prompt allowing the user to
adjust the number of bins used to display the distribution.
Please read the information in the dialogue carefully if this is
your first run of analysis in Extinction Suite.
- To see the value of using a different bin number, choose "Yes"
from the "Redisplay Histogram" drop-down menu.
- Enter 60 into the new bin number.
- Click OK and see the redisplayed histogram:
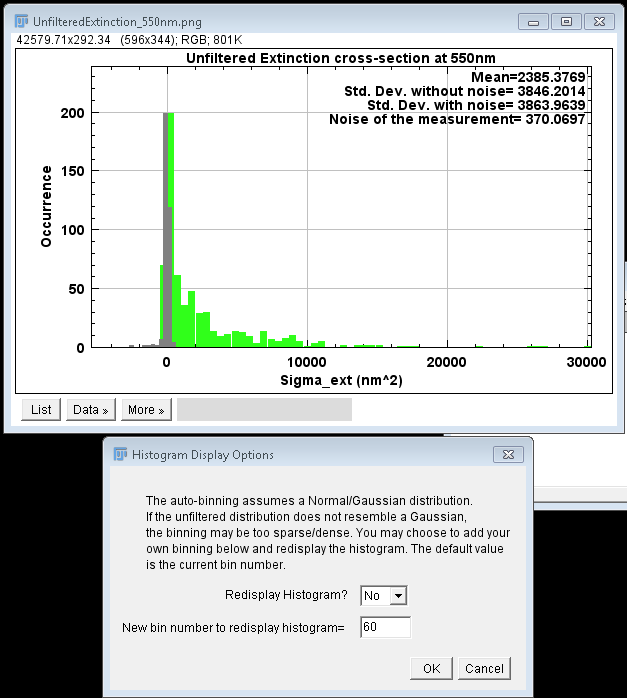
- Clear subpopulations can now be seen. Choose "No" from
from the "Redisplay Histogram" drop-down menu.
- Click OK.
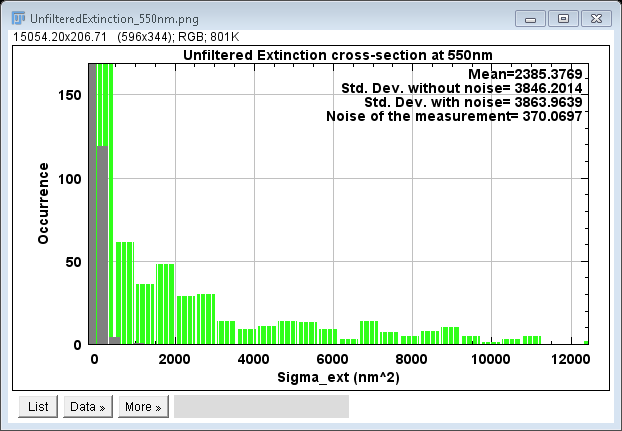
- Due to the scaling and auto-labeling of the plot axes, users
might often find that resolution of plot ticks is frequently not
fine enough to make confident decisions in determination of the
acceptable cross-section range. The user is prompted with a
dialogue allowing them a chance to zoom/pan in the histogram
plot window:

- To zoom/pan in the histogram window, simpy hover the cursor
near the axes. You can then adjust the plot axes via the arrows.
An example of a possible zoom is seen here:
- Click OK to close the dialogue and end this examination of the
histogram window.
- The user will now be prompted to input values for the minimum
and maximum acceptable cross-sections.
- Note if we call the mean cross-section \(\bar{\sigma}\) and
the standard deviation of this cross-section \(\hat{\sigma}\),
then the default values entered for min/max acceptable range
are min=\(\bar{\sigma}\)-3\(\hat{\sigma}\) and
max=\(\bar{\sigma}\)+3\(\hat{\sigma}\), i.e. 99.73% of the
population of an assumed Gaussian distribution. As one can see
from the example, we do not have a monodisperse Gaussian
distribution, so the default values should not typically be
trusted implicitly
- Enter min=4000nm2 and max=12000nm2.
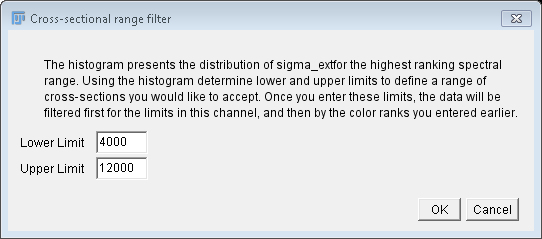
- Click OK.
- The software will now filter all data to exclude
cross-sections outside of the indicated range, and which match
the ranking configuration applied by the user earlier. Note, we
used 1,1,1,1, so that all channels are equally ranked and
therefore no rank-exclusion is applied in this case.
- Once filtering has finished, Extinction Suite terminates. If
there were no errors you will be prompted with a dialogue
informing you of completion and the Log window will be saved to
the Data folder.

11. Results
- The analysis log is a text file containing all the values and
options chosen by the user during the analysis. The log for this
analysis example can be found here.
- The Data folder will now look like this:
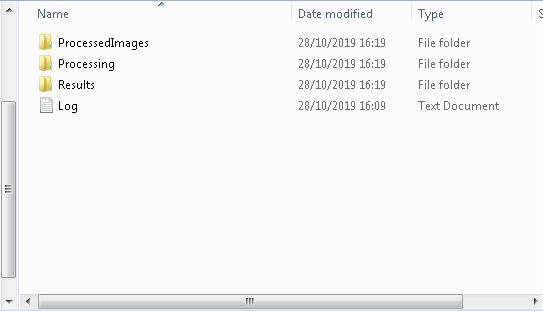
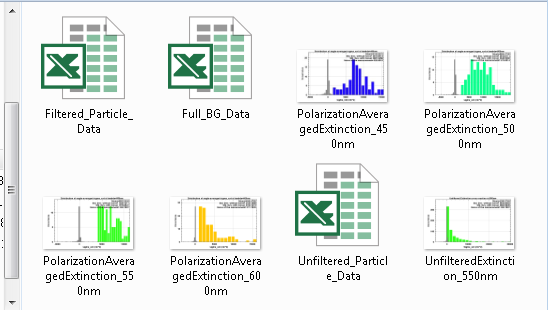
- The Results folder was added to Data folder and is filled with
the histograms of the fully-filtered particle cross-sections in
all channels, and the proximity-filtered particle cross-sections
(otherwise unfiltered) in the "main" color channel, as well as
the full numerical data in excel format for the background data,
filtered data, and unfiltered data. The folder will look like
this:
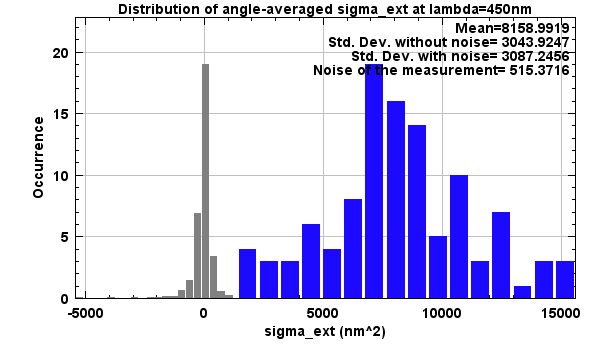
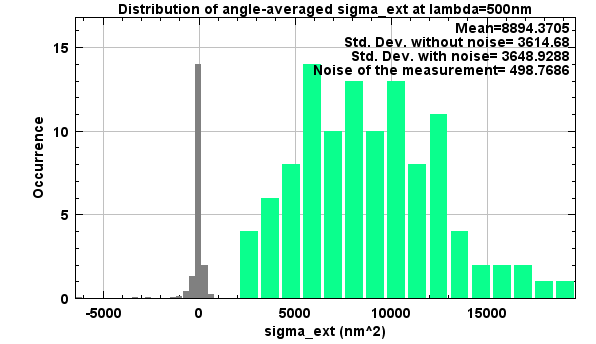
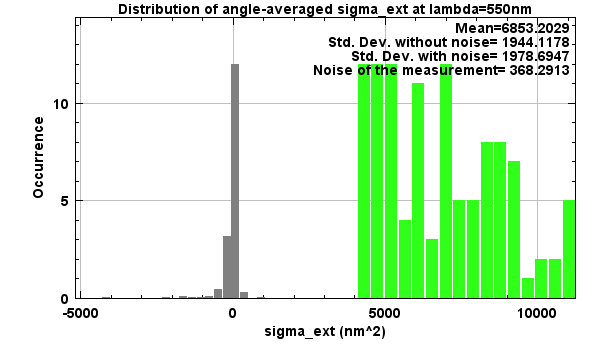
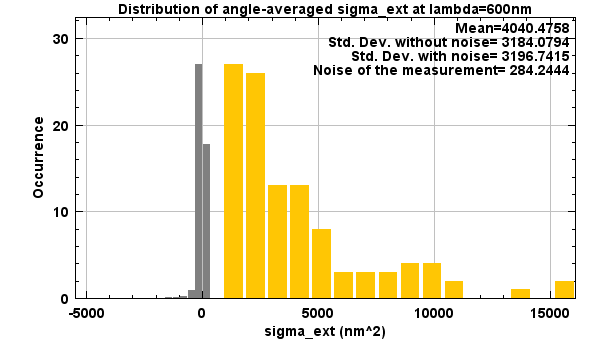
- The histograms are saved as PNGs. In this example, these are
the resulting plots:
- The "ProcessedImages" folder will now contain a new image
called "LabeledParticles.tif" which is simply the "main"color
channel image, where numeric labels have been added to the image
just to the right of the locations of the final, filtered
particles. These numeric labels match the particle ID in the
excel file of the filtered particle data.
Created by Lukas Payne, 27/10/2019.