Example of hyperspectral image analysis of Raman data using the
software HIA2.3
Unzip RamanData.zip
RamanData.asc: hyperspectral Raman intensity images of a
hippocampal tissue of from a patient with Alzheimer's disease
acquired with the confocal Raman microscope at School of Biosciences
(Cardiff University).
Laser excitation: 532nm. Grating:300l/mm. Software: Andor Solis.
1. Import hyperspectral data
- File>Load>Ascii
- alternatively drag and drop the
file on the HIA panel
2. Select the column with data

- For data acquired with the Andor Newton Camera, Andor Solis
software, the Raman intensity is stored in the second column of
the ascii file.
- Press OK
3. Set import parameters

- Insert the acquisition settings
- For the Andor Solis
- see Galileo_Raman
webpage for grating calibration and sensitivity
- Notice that in the import panel the polynomial is in
(pixel-1), so that the constant term for the import panel is
the sum of the constant, first and second order terms in the
webpage where the polynominal is in (pizel).
- If you have saved the parameters previously you can import
them with Load Ascii Parameters
- It is recommended to save the parameters as they are
common to the data taken with identical settings
- For the RamanData.asc the parameters are saved in the ImportSettings.par file
- Press OK
4. Select pixel range for offset
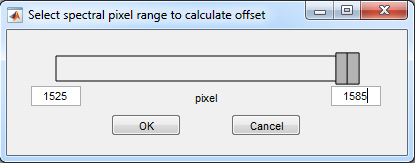
- For the 300l/mm: range 1525-1585
- Press OK
- If you are not sure, first import the data without offset and
without conversion, and look at the spectra to identify the
range which is blocked be the filters
5. Set interpolation setting
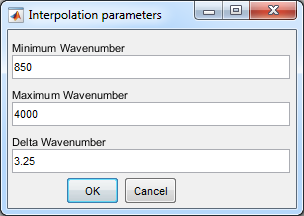
- Set the interpolation settings for the wavelength to
wavenumber correction
- Press OK
- To verify the laser position, which should be at zero
wavenumbers, use a negative minimum wavenumber. After
verification, it sufficent to keep the relevant range which is
transmitted by the filter.
6. SVD filtering
- Analysis>SVD denoising
- SVD settings:
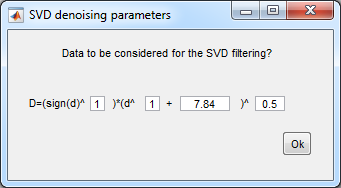
- the offset term is the
read noise squared.
- Press Ok
- Denoising settings:
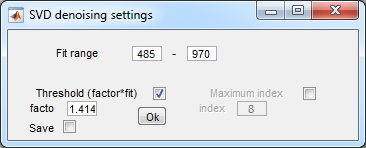
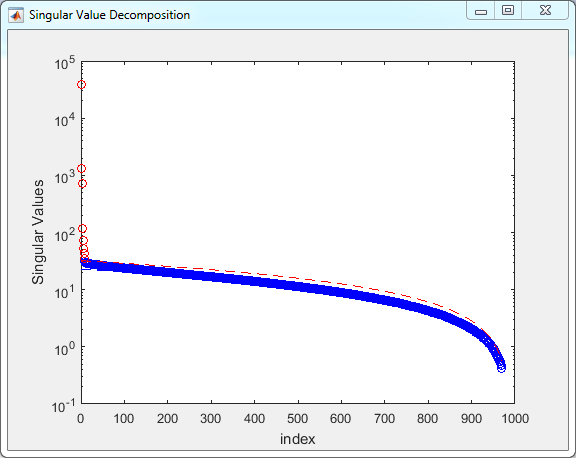
- Press Ok
- Do not overwrite Data 1
- You can also use a lower threshold (e.g. 1.2) not to remove
possibly relevant components.
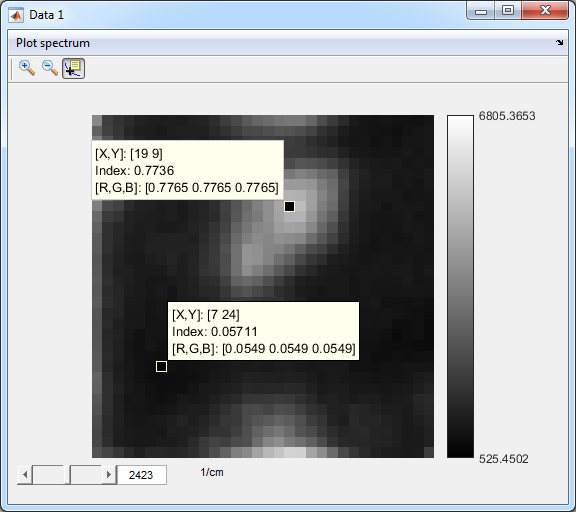
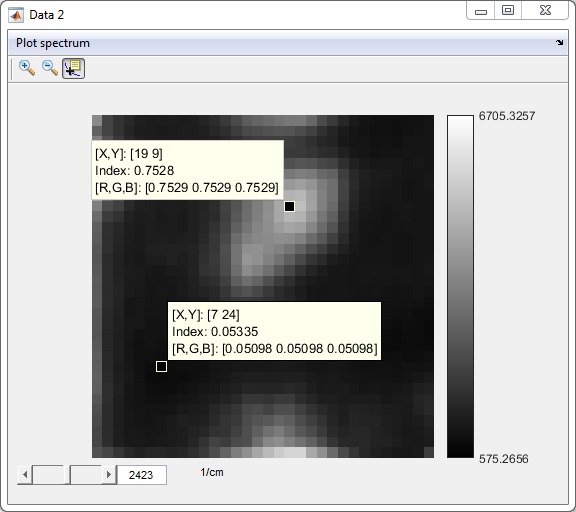
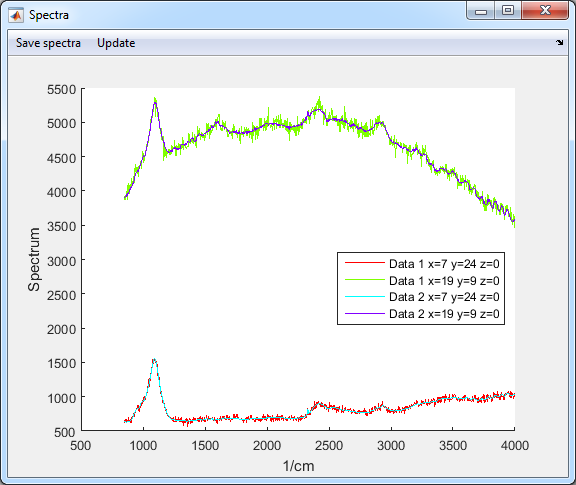
- Check SVD denoised data (Data 1: original data, Data 2:
denoised data)
7. Background fit
- Select the SVD filtered data (Data2)
- Analysis>Background subtraction (robust fit)
- Background subtraction (robust fit) settings
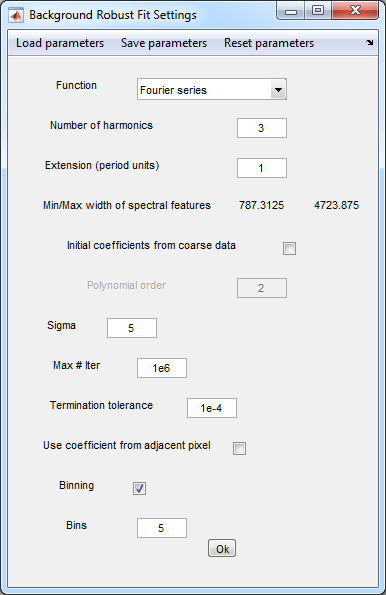
- For the RamanData.asc the parameters are saved in the BGfit.par file
- Press Ok
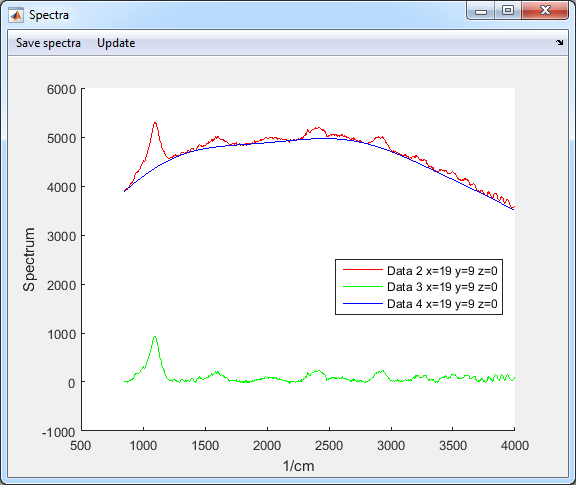
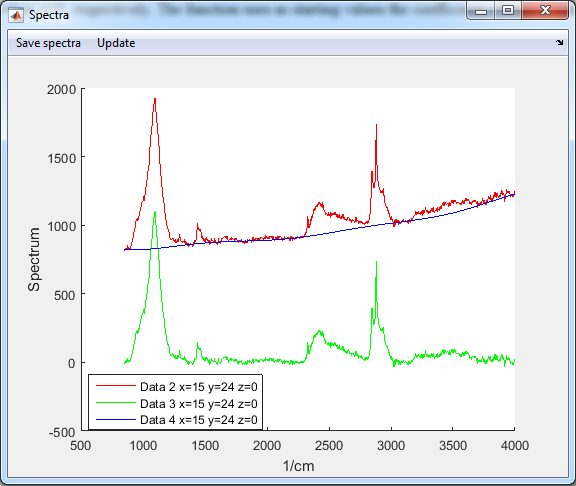
- Two new datasets are generated
- Data 3 is the residual of the fit (Raman resonances)
- Data 4 is the background fit (Auto-fluorescence)
8. Save compressed data
- You can save the data after certain steps of the analysis,
Data compression uses SVD filtering
- Select Data3
- File>Save>HIA file
- Data type: 16bit
- SVD denoising parameters:
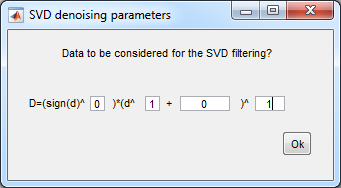
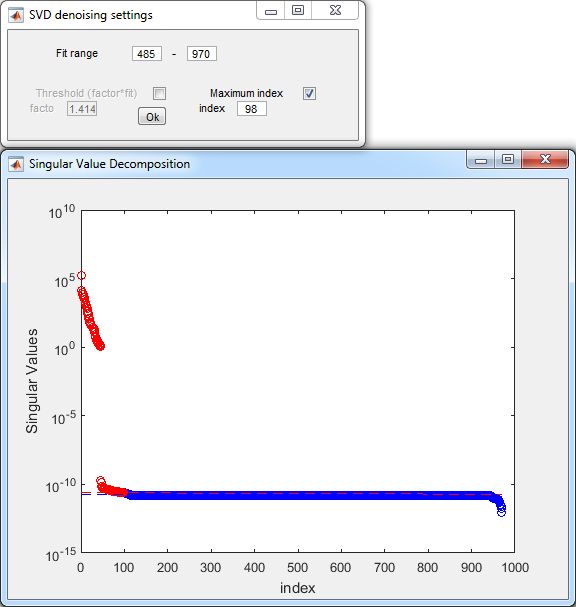
- Press Ok
- Repeat for Data4
8. Limit Spectra Range
- Select Data3
- Only if needed
- Image>Limit spectral range
- Do not overwrite Data3 (creates Data5)
9. Exclude regions
- Only if needed
- Select Data5
- Image>Exclude Regions
- Type>Crop
- Energy>Range
- Selection->Polygonal
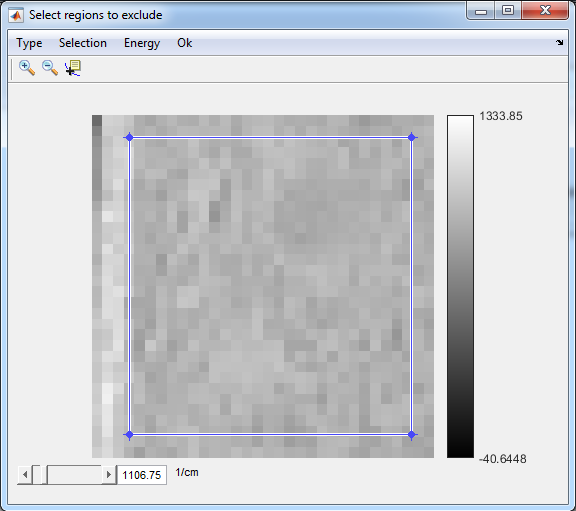
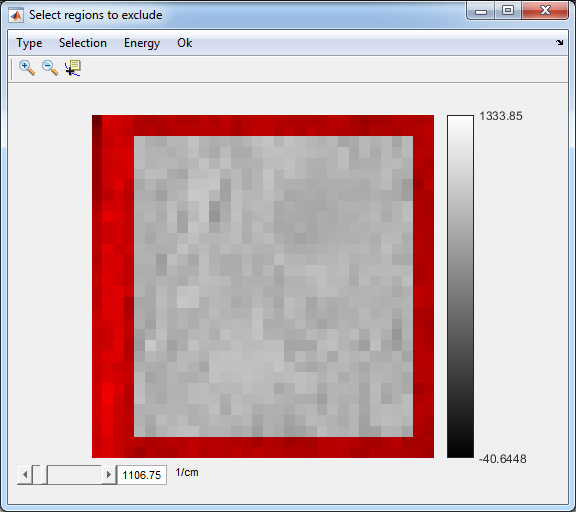
- Double-click inside the selected region
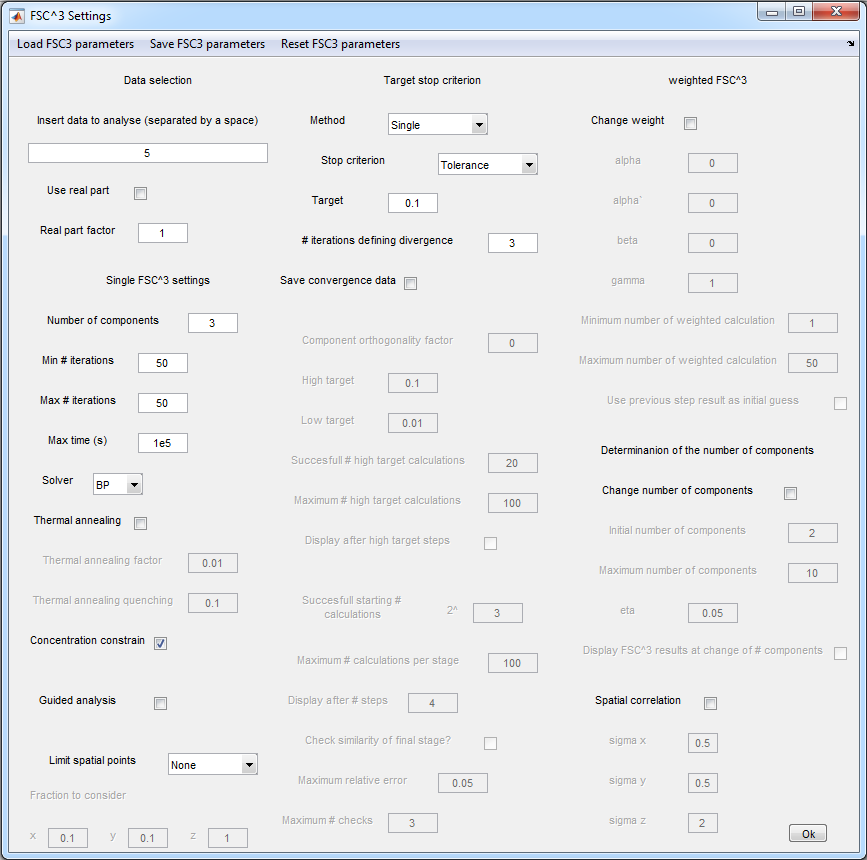
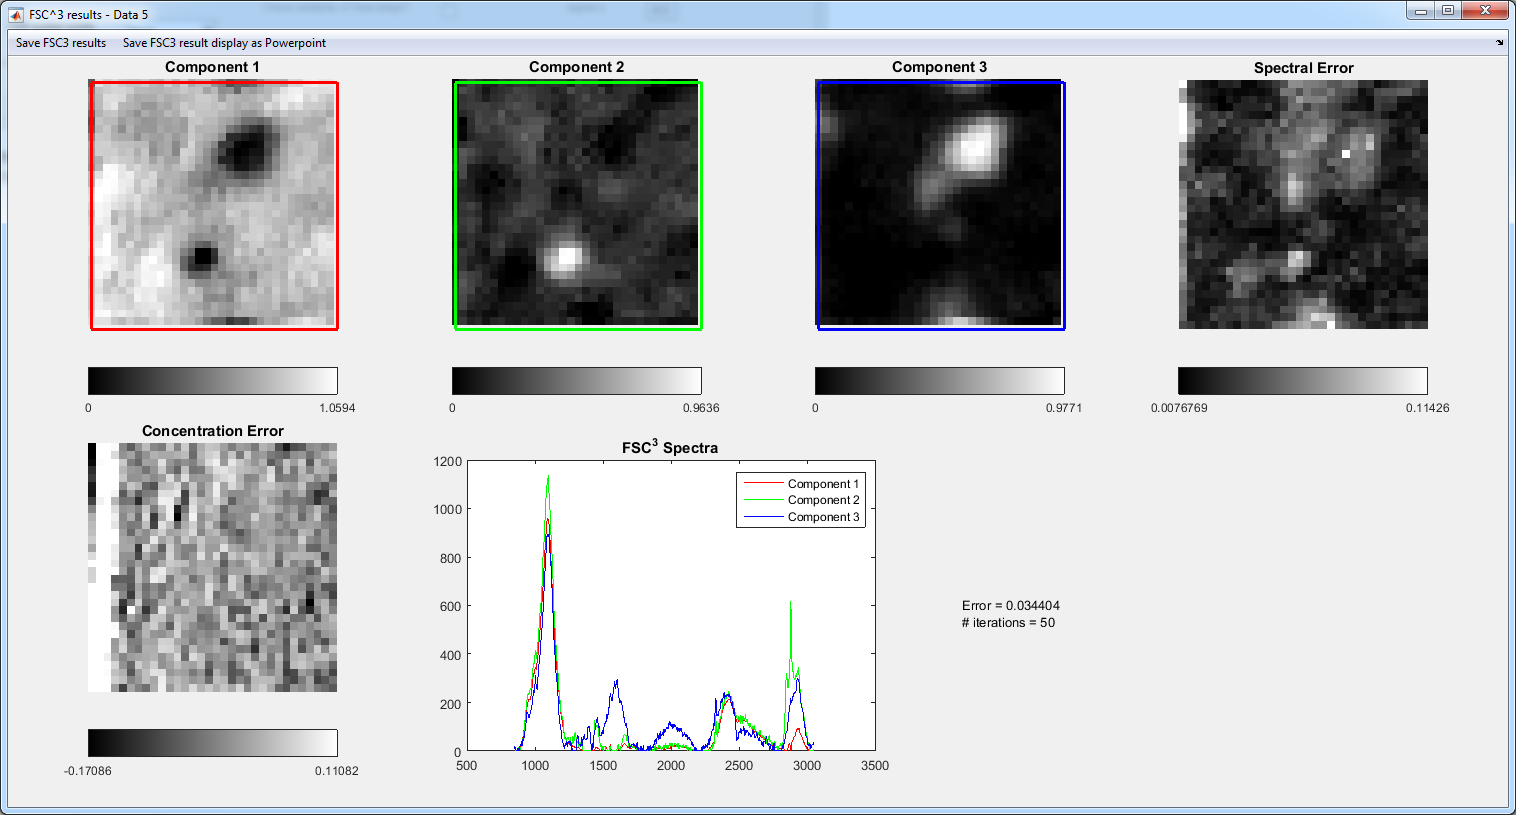
10. FSC3
02/11/2015, Francesco Masia, Modified
18/11/2015


